Note
Go to the end to download the full example code.
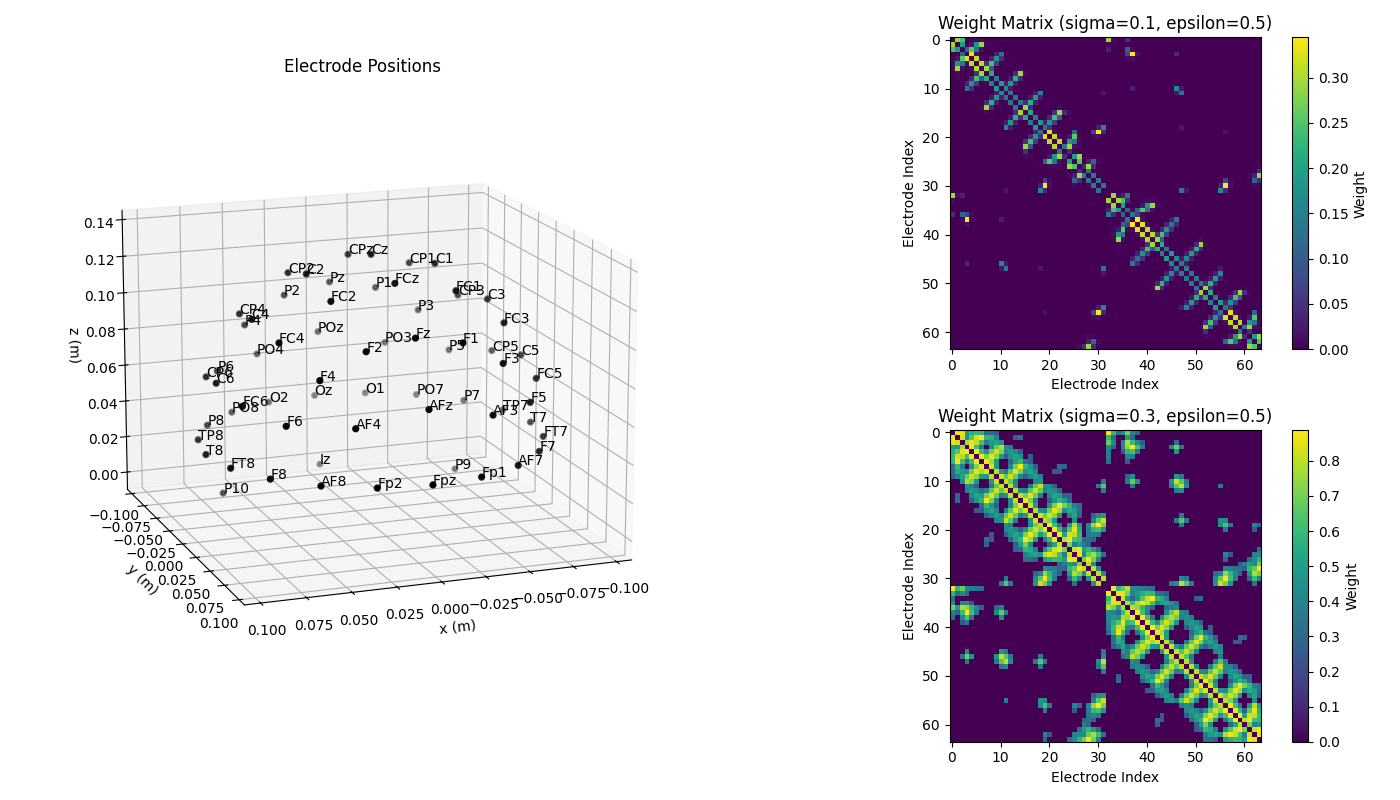
Make Gaussian Graph.
This example demonstrates how to create a graph from EEG electrode positions using a gaussian kernel. The example uses the Biosemi 64 channel montage. The graph is created with two different values of sigma (0.1 and 0.3) and epsilon=0.5.
import matplotlib.pyplot as plt
import mne
import numpy as np

from eegrasp import EEGrasp
montage = mne.channels.make_standard_montage('biosemi64')
ch_names = montage.ch_names
eeg_pos = montage.get_positions()['ch_pos']
# Restructure into array
eeg_pos = np.array([pos for _, pos in eeg_pos.items()])
# Initialize EEGrasp object
eegrasp = EEGrasp(coordinates=eeg_pos)
# Compute distance matrix
Z = eegrasp.compute_distance(method='Euclidean')
# Compute weight matrix
G = eegrasp.compute_graph(epsilon=0.5, sigma=0.1, distances=Z)
W = eegrasp.graph_weights
# Compute new weight matrix
G2 = eegrasp.compute_graph(epsilon=0.5, sigma=0.3, distances=Z)
W2 = eegrasp.graph_weights
#  Plot Montage
fig = plt.figure(figsize=(14, 8))
ax = fig.add_subplot(1, 2, 1, projection='3d')

montage.plot(kind='3d', axes=ax, show=False)
ax.view_init(azim=70, elev=15)  # set view angle
plt.title('Electrode Positions')

# Plot Graph
ax = fig.add_subplot(2, 2, 2)
im = ax.imshow(W, cmap='viridis')
ax.set_title('Weight Matrix (sigma=0.1, epsilon=0.5)')
plt.colorbar(im, label='Weight')

ax.set_xlabel('Electrode Index')
ax.set_ylabel('Electrode Index')

# Plot new Graph
ax = fig.add_subplot(2, 2, 4)
im = ax.imshow(W2, cmap='viridis')
ax.set_title('Weight Matrix (sigma=0.3, epsilon=0.5)')
plt.colorbar(im, label='Weight')

ax.set_xlabel('Electrode Index')
ax.set_ylabel('Electrode Index')

plt.tight_layout()
plt.show()
Total running time of the script: (0 minutes 0.776 seconds)
Estimated memory usage: 189 MB